Measuring end-to-end latency of the prestudy setup (2019-01-17)
Tagged as: prestudy, end-to-end latency, latency
Group: C
This blog entry describes our way of measuring the end-to-end latency of the test setup of the prestudy.
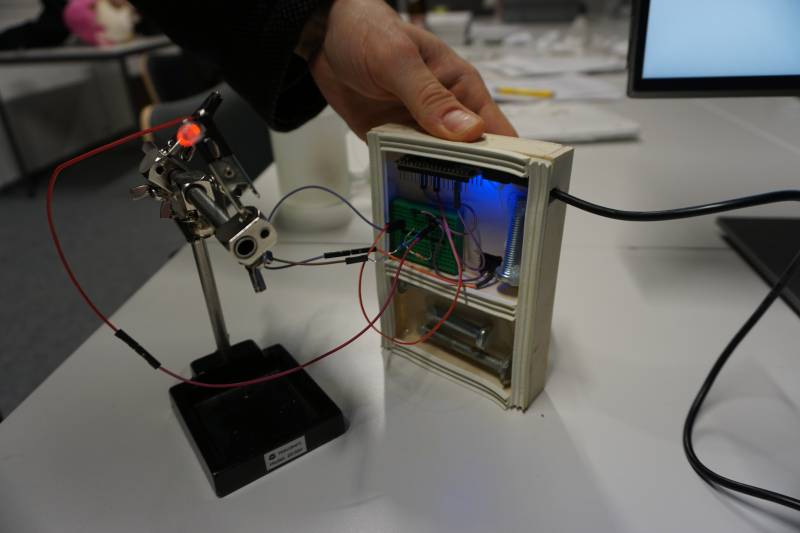
For the prestudy, our “Pusher”-Button was used to add latency to input events. This addition of latency was done by using an Arduino Microcontroller which ran code to create artificial latency. The latency of the Arduino and the button could be measured using the LagBox (Bockes et al., 2018) and was around 2,11 ms (with 0,45 ms standard deviation).
But there are many different sources of latency that should be considered:
- The operating system (Linux Mint)
- The software (The dino game coded in python using the pygame library)
- Hardware like the monitor
- …
For our experiment not single sources of latency are important, only the end-to-end latency or the time from a button press (input event) to the reaction displayed on the screen (output event) is relevant. While doing research on how to measure end-to-end latency, we found the paper “Feedback is… Late: Measuring Multimodal Delays in Mobile Device Touchscreen Interaction” (Brewster et al., 2010). According to their suggested approach we also measured the end-to-end latency using a high speed camera.
The camera needs to be able to pick up two distinct visual stimuli. The input event and the output event
a) Show when the button is pressed
It is not easy to find the exact moment the button is pressed on camera when a finger is directly placed on the button itself. Therefore a LED was connected directly to the button that lights up immediately on an input event. The LED was attached to a helping hand so that it could be positioned right next to the screen.
b) Make it clear when the output event starts
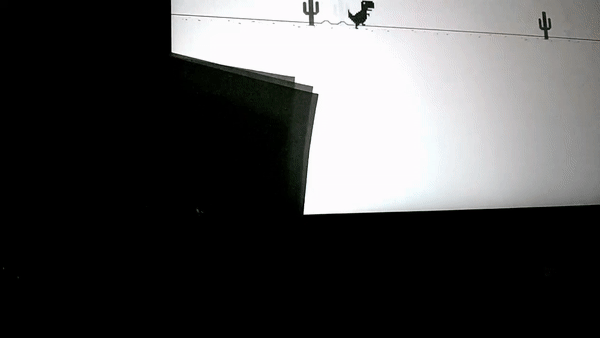
The press of the button causes the dino in the game to jump. Since the dino only makes up a small portion on the screen it can not be distinguished easily on video. Therefore the code of the game was slightly modified. Everytime the “jump()” method is called, the screens turns red. We left the rest of the code as it has been during the study experiments in order to get results comparable to the overall latency during the tests.
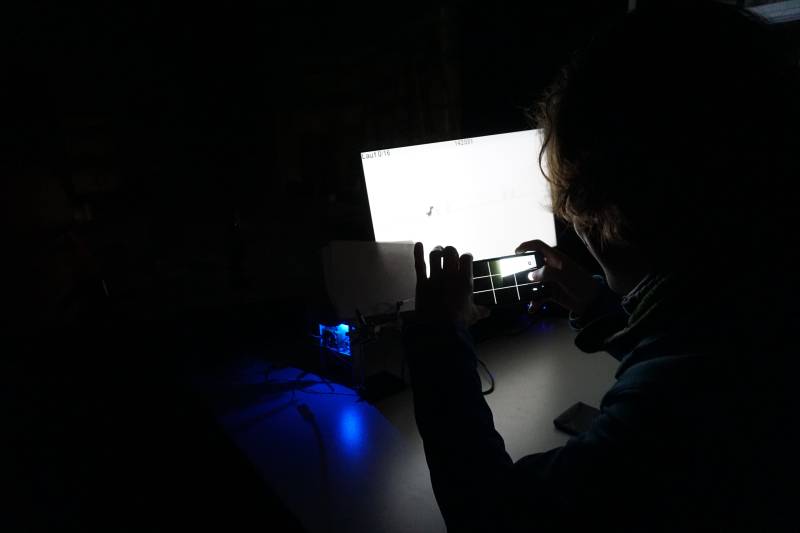
For the camera, we used a Google Pixel 2XL smartphone. It is capable of filming slow motion video with 240 frames per second. This was our best option since no “faster” camera was available. But 240pfs means that a frame is taken every ~4.17 milliseconds This also should be the maximum deviation of our measured value and the real world value. Brewster et al. used a camera capturing 300fps and reported good data for their purposes (QUELLE PAPER). Multiple recordings were made. The following picture shows the procedure:
The following gif clearly shows the end-to-end latency between a button press and and the output event on the screen. Since the screen updates at 60fps and the camera records at 240fps, it can even be clearly seen that it takes about 4 frames on video until the display has turned completely red. (Click on the image if the gif does not play correctly):
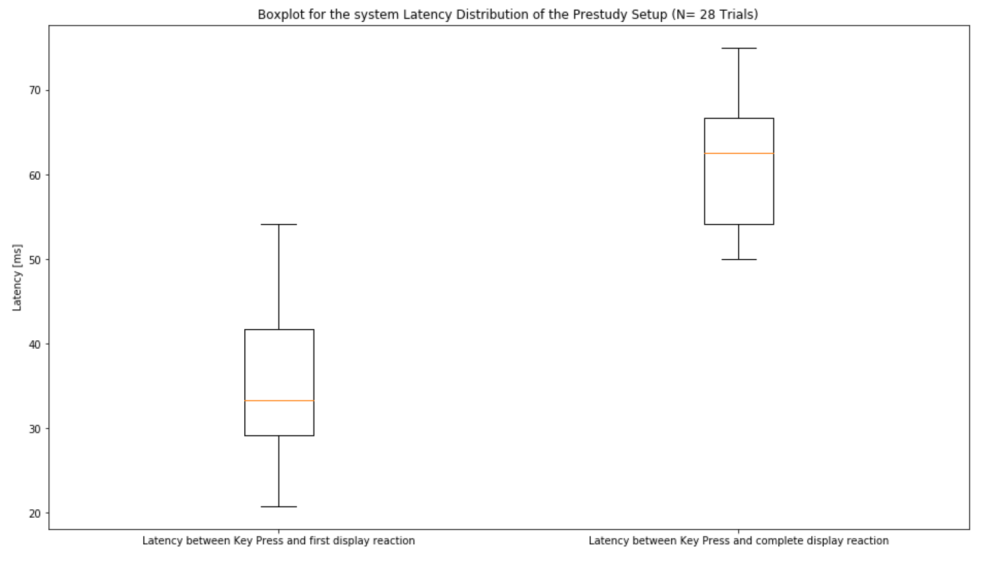
The video files were annotated by hand. The time between the first frame where the led begins to light up and the first display reaction (screen starts changing color) and the complete display reaction (screen is completely red) is measured. The data has been put into a jupyter notebook and was plotted in the following boxplot diagrams:
The results of our end-to-end latency tests showed a mean overall latency of 61.21 ms and a standard deviation of 7.02 ms, which are comparable to values elicited by Casiez et al. in the Paper Looking through the Eye of the Mouse: A Simple Method for Measuring End-to-end Latency using an Optical Mouse (Casiez et al., 2015)


