**Dies ist eine alte Version des Dokuments!**
Finalizing the main study (2019-02-11)
Tagged as: blog,
Group: C
We parametrized the values for the main study and conducted the pre main study. Also we had several problems to solve.
Finalizing the main study
How does latency and latency variance influence the performance and the user experience? How much variance is acceptable? What is worse? Latency or latency variance?
Study Design
After planning the main study, it needs to be designed. Our variables are the following:
Variables
- dependent: score
- independent: base latency, latency variance
- control: all test persons use the same hardware
- random: people coming in surprisingly, background noises, power breakdown
- confounding: there is not really a confounding variable, but since we will test on two locations, we will consider the background noises / environment
Parameterization
Furthermore, the study needs to be parameterized. For this approach, we read literature to learn how other researcher handled the range of latencies for their studies. Scott MacKenzie presents in his paper “A comparison of input devices in elemental pointing and dragging tasks” an experiment where three devices (mouse, tablet and trackball) get compared and each task is modelled after Fitt´s Law (MacKenzie, 1991).
(Fitt´s Law is a model of human movement and “[…] predicts that the time to acquire a target is logarithmically related to the distance over the target size(MacKenzie, 1991, page 161)” ).
Vitus and a fellow student of us, Ariane Demleitner, wrote literature reviews about latency and Fitt´s Law. Demleitner describes in her paper that MacKenzie et al. used latencies in the range of 25 to 255 milliseconds. We decided to chose the same range.
But what about the latency variance? What range is adequate for this? Since there is not much literature about experiments with latency variance, we have to do an ‘educated guess’.
An important question is: Do we use absolute or relative values? Relative values means adding for example 10% of the current base latency as variance to it. This is something we need to find out in the pre main study.
We decided to choose relative values. In the following, our parameters are listed:
Final parameters
Latency values (ms)
- 0
- 35
- 75
- 105
- (2010)
Latency variance values (%)
- 0
- 25
- 50
- 75
Problems
While finalizing the main study and planning the pre main study we detected that there a still a bunch of problems and we had a real chaos day. The problems within in the game could be solved but the minor issue was our end-to-end latency. In a previous blog entry we described how to measure this latency and in the same way we did it for the main study. But the calculated value was way too high and we don´t know where all the latency comes from. So we had discussions with our stake holder Andreas Schmid if a C++ application would be better than Qt and if we should conduct the main study with such high latency values.
Despite this, we conducted the pre main study.
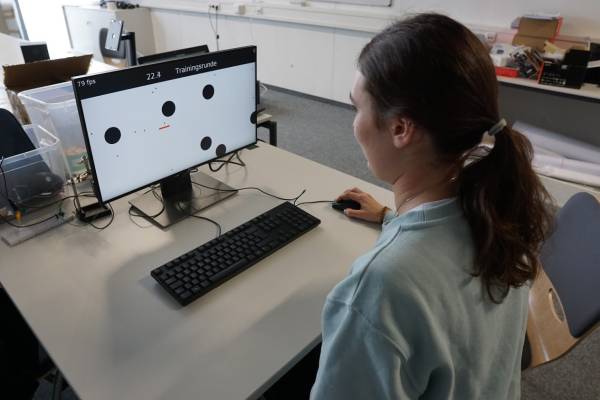
Pre main study
In the study before the study we tested the following aspects:
- perfect functionality of the game
- values of latency variance
- target sizes
- number of targets
- target speed
- time per participant
This study was conducted in the TechLab with 6 participants ages 24,24,26,26,28,30. We resigned using the questionnaire for the gaming experience and the open interview after the test, since the functionality of the application was the most important subject.
Results
- it takes about 10 minutes per participant
- we need to collect the email addresses separateley (privacy) and only of participants with realistic changes getting into the top 3
References
- Demleitner (2018): A Review of Fitts’ Law and Latency of Input Devices.
- MacKenzie (1992): A comparison of input devices in elemental pointing and dragging tasks.
- Maierhöfer (2018): Latency and Fitts’ Law.