Inhaltsverzeichnis
Results and Analysis (2019-02-28)
Tagged as: blog, analysis, evaluation
Group: E
We evaluated and analyzed our data.
Paper
We wrote a scientific paper containing our methods, findings, evaluation, analyzation, conclusion and outlook. We submitted it to the legendary FSM WS 18/19 conference and are awaiting reviews.
Evaluation
To evaluate our findings we tested our dataset on normal distribution with Shaphiro-Wilk test. None of our results are normal distributed so we conducted a Mann-Whitney-U test.
Thereby we tested our dataset against the data acquired from the LagBox-project. These comparison resulted in one non-significant result. The Logitech-Wingman Gamepad at default polling rate shows no significant difference to the LagBox data. To examine if our measurements of the same device are consistent in themselves we performed a Wilcoxon signed-rank and Levene test.
The Wilcoxon signed-rank test shows four non-significant devices. The Logitech G5 (forced), Logitech G15 (forced), Speedlink Strike Green (default) and SpeedLink Strike Green (forced) showed no significant differences. These findings are equal distributed on all of our tested device types.
The second significance Test, namely Levene-Test, checks the equalness of the variances of 2 groups. A non-significant result indicates equal variances within a given level (alpha). The test resulted in 6 non-significant devices with given polling: G15 forced, RX250 forced, Acer Keyboard default and forced, Speedlink Strike (green) forced and Speedlink Strike (black) forced.
Analyzation
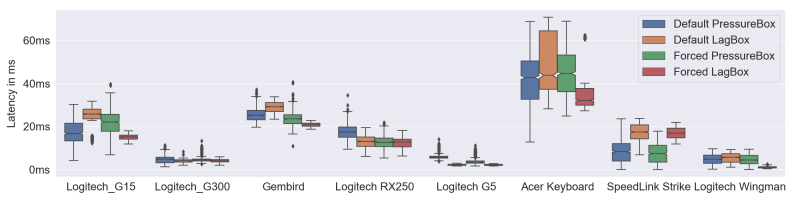
We measured 9 devices, which were tested by Bockes et al.[1], too. Closer inspection of both measurements indicate similarities. By comparing standard deviation differences, we have 17 configurations that differ less than 1ms. And looking at the median latency, divergence for some devices seem to be smaller than expected. For instance, difference in latency of the Logitech G300 mouse is less than 0.7ms.
Another way to compare such data is by analyzing diagrams. We used a boxplot, as seen above, and swarmplots to visualize differences in both measurements.
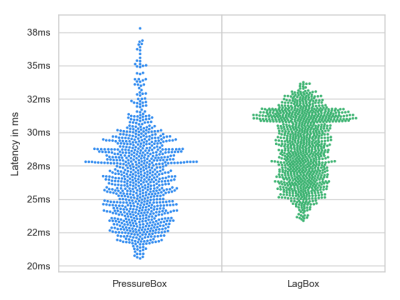
The above plot shows a comparison of the Gembird Keyboard with default polling and its counter-part measured by the LagBox. It shows a higher variance in the PressureBox data, bodies that look similiar and similiar latency values.
First Conclusion
Even though most of our results show a significant difference to the data we deem as the actual latency, we are not entirely unhappy with our findings. We were able to show that we can produce pretty reliable results within each measurement. Also, for the most part the latency we collected are not that far from the ones we tested against. Though it appears there might be a systematic error within our measurements that varies from device to device and especially from button-type to button-type. With a big likelihood this error originates from the accuracy of our calibration. Even though it is pretty precise it may not be precise enough to determine the exact step-size, an event gets triggered. A compromise between consistently getting events and using the smallest possible step-size had to be made here. It may also worsen the 'wobblier' a button is. This is reinforced by the result, that the only finding that had no significant difference was the Logitech Wingman, which had one of the hardest buttons to press with the least wiggle room. Additionally, it probably is connected with the way we calculate our latency. As we use the timestamp the motor stopped moving as the time an event was triggered, the actual triggering may have happened a little time beforehand. To determine how much exactly we were off, we conducted some measurements with a setup, where we could set a fixed latency, as mentioned above. Unfortunately the results, though pretty consistent, were not close enough to the differences in latency we found in our evaluation and could therefore not be used in explaining the systematic error nor determining its value. Keeping these restrictions in mind our non-invasive approach can help to classify the share of input latency in end-to-end latency.
References
[1] Florian Bockes, Raphael Wimmer, and Andreas Schmid. 2018. LagBox – Measuring the Latency of USB-Connected Input Devices. In Extended Abstracts of the 2018 CHI Conference on Human Factors in Computing Systems (CHI EA ’18). ACM, New York, NY, USA, Article LBW115, 6 pages.https://doi.org/10.1145/3170427.3188632