Final Study Design (2019-01-31)
Tagged as: blog, study, implementation
Group: H
The study design is finally implemented and can be used for the tests.
Study Implementation
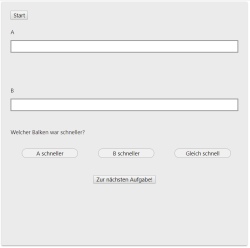
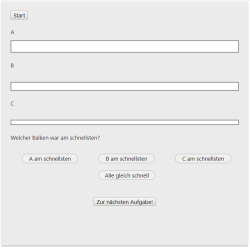
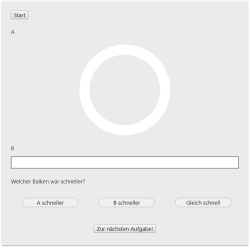
We have created each of our 3 studies as an HTML page and inserted the individual combinations on each card. The cards are pseudo-randomized for each participant to counterbalance the study results.
- In Study 1, there are 25 combinations of different quickly animated progress bars. There are 2 extra cards with progress bars that are faster or slower than the normal bars to keep the users on track.
- In study 2, there are 5 combinations of three different progress bars.
- In Study 3, there are 5 combinations of a charging circuit and a progress bar.
The structure can be seen on the following screenshots.
Participants have to watch each combination and then choose if one of the progress bars/circles is faster than the other or if they are equal in perceived speed.
The results are output in the Chrome browser in log files in the following format:
- studie1.html:1831 17:27:29 CD: Balken C
- studie1.html:2613 17:27:31 TestB: Balken B
- studie1.html:2133 17:27:33 DD: Balken D
- studie1.html:1169 17:27:34 AC: A + C gleich schnell
We now recruite 20 participants via Email and Facebook to conduct the study in the following week.
Study Results
To analyze the results we use different approaches for the studies. We will add up the faster felt bars. This also results in the representation of a result matrix in which the combinations from A to E are compared and added up in each case. A colored representation of the fastest and slowest perceived bars is inserted.


